|
Performance
assessment
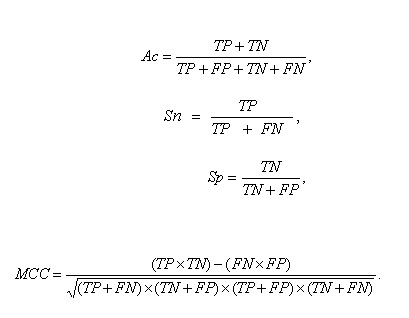
Four measurements, i.e. Ac, Sn,
Sp and
MCC, were used
to evaluate the prediction performance with definitions as below:

TP, FP, FN and TN denote true positives, false positives, false negatives and true
negatives.
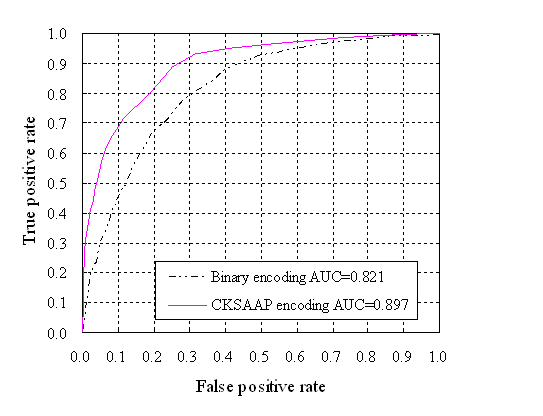
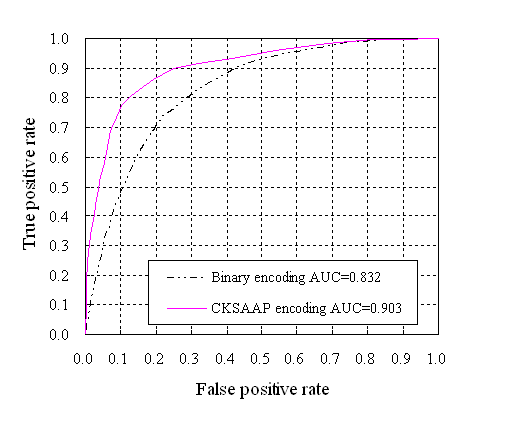
The prediction accuracy was also measured by using the ROC analysis
. For a prediction method, the curve of ROC plots true
positive rate (i.e. Sn) as a function of false
positive rate (i.e. 1-Sp) for all possible thresholds.
The AUC was also calculated to provide a comprehensive understanding
for the proposed prediction method. Generally, the closer the AUC
value is to 1, the better the prediction method.
The detailed result of
CKSAAP encoding based on the ratio 1:5 of O-glycosylation sites to
non-glycosylation sites through 10-cross
validation is shown in the following table:

To further evaluate the
prediction performance, the ROC curve is also shown below:
Prediction of O-glycosylated S sites

Prediction of O-glycosylated T sites

|

