Alternative Splicing Analysis Tool Package (ASATP)
version 0.7
Content
Alternative splicing analysis tool package (ASATP), including a series of toolkits to analyze alternative splicing events, which could be used to
![]() detect
and visualized alternative splicing events,
detect
and visualized alternative splicing events,
![]() check
ORF changes,
check
ORF changes,
![]() assess
regulations of alternative splicing and
assess
regulations of alternative splicing and
![]() do
statistical analysis.
do
statistical analysis.
The users could either access this software from our webserver, or download it from GitHub.
To use ASATP, you need install Perl(>5.10). And some Perl modules are needed:
Bioperl
Bio::Graphics
GD::Image
GD::SVG
Statistics::R
Math::BigInt
You can use CPAN command to install modules needed. For example:
perl -MCPAN -e 'install HTML::Template'
ASRecovist
Alternative splicing recognition and visualization tool, which is a program to detect alternative splicing events from a gene annotation and classified them into different types (CE, IR, MXE, A3SS, A5SS, AFE, ALE and other). Alternative splicing events will be showed in tables and graphs.
ASQuantityDiff
Alternative splicing quantity comparison between samples, which was used to detect expression regulations of alternative transcripts.
ASAffectORF
Check AS event in CDS region, to identify the effect of alternative splicing event for ORFs.
runASATP
Run Alternative splicing Analysis Tool Package, which was a combined pipeline including ASRecovist, ASQuantityDiff and ASAffectORF.
asp2bit
Transform AS pattern to bit matrix.
bit2asp
Transform bit to ASP code.
splitGtf
Split a GTF file when it's too large to process. Then you can process them separately using multi-CPU to save time.
NAME Alternative splicing recognition and visualization tool
SYNOPSIS Usage: perl ASRecovist.pl --gtf <gtf_fortmat_file> --output <output_fold> [--graph no] [--graphFormat SVG] Options: -help|h --gtf STRING Input gtf format file. --output STRING Output folder. --graph no|yes Create graph or not. default [no] --graphFormat SVG|png Graph format. default [SVG]
|
GTF (Gene Transfer Format) is a refinement to GFF that tightens the specification. The first eight GTF fields are the same as GFF. The group field has been expanded into a list of attributes. For more information on this format, see https://genome.ucsc.edu/FAQ/FAQformat.html#format4
Four tab separated files (i.e. AS_event.xls, AS_event.summary.xls, AS_event_group.xls and AS_event_group.summary.xls) were outputted.
AS_event.xls: alternative splicing event between transcripts of the same gene. Each column:
Description |
Example |
|
Gene |
gene id |
G04034 |
Chromosome |
chromosome/scaffold/contig id |
contig6.12 |
Strand |
gene strand |
+ |
Transcript1 |
the 1st transcript in an alternative splicing event |
G04034T0 |
Transcript2 |
the 2nd transcript in an alternative splicing event |
G04034T1 |
AS Pattern |
alternative splicing pattern (ASP) code |
2 |
AS Event Type |
alternative splicing type |
IR |
AS Event Span Unit |
start and stop position of an alternative splicing event |
1009411-1009632 |
AS Bit Span Unit |
span unit of an alternative splicing event, which corresponding bit matrix |
1009272-1009410, 1009411-1009632,1009633-1009680 |
AS_event.summary.xls: Summary of alternative splicing event. Each column:
Column |
Description |
Example |
AS Pattern |
alternative splicing pattern (ASP) code |
8 |
AS Event Type |
alternative splicing type |
A5SS |
AS Event Num |
number of alternative splicing event |
1 |
Gene with AS Event |
gene number with alternative splicing event |
1 |
Transcript with AS Event |
transcript number with alternative splicing |
2 |
AS_event_group.xls: alternative splicing events between different transcripts in a gene will be grouped when they are with the same ASP codes and the same span units of genome coordinates. Each column:
Column |
Description |
Example |
Gene |
gene id |
G04034 |
Chromosome |
chromosome/scaffold/contig id |
contig6.12 |
Strand |
gene strand |
+ |
AS Event Groups |
alternative splicing event groups in a gene |
as_g1 |
AS Pattern |
alternative splicing pattern (ASP) code |
2 |
AS Event Type |
alternative splicing type |
IR |
AS Event Span Unit |
start and stop position of an alternative splicing event |
1009411-1009632 |
AS Bit Span Unit |
span unit of an alternative splicing event, which corresponding bit matrix |
1009272-1009410,1009411-1009632,1009633-1009680 |
Transcript1 |
the 1st transcript in an alternative splicing event |
G04034T0 |
Transcript2 |
the 2nd transcript in an alternative splicing event |
G04034T1 |
AS_event_group.summary.xls: Summary of alternative splicing group. Each column:
Column |
Description |
Example |
AS Pattern |
alternative splicing pattern (ASP) code |
8 |
AS Event Type |
alternative splicing type |
A5SS |
AS Event Group Num |
number of alternative splicing event groups |
1 |
Gene with AS Event |
gene number with alternative splicing event |
1 |
Transcript with AS Event |
transcript number with alternative splicing |
2 |
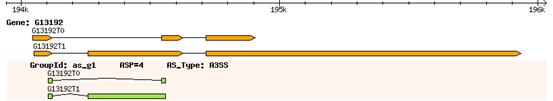
For each gene, a graphic structure of alternative splicing events could be produced. Gene structure in the genome is show in the top track. The other tracks represent groups of alternative splicing events in a gene. The group id, ASP code and alternative splicing type are labeled. For example,
ASRecovist support two graphic formats (i.e. png and svg).
perl ASRecovist.pl --gtf anno.gtf --output output_svg/ASRecovist_out --graph yes --graphFormat svg
NAME Alternative splicing quantity diff comparison betwwen samples.
SYNOPSIS Usage: perl ASQuantityDiff.pl --asEvent <AS_event.xls> --asGroup <AS_event_group.xls> --trExpFile <transcript_expression_file> --output <output_fold> Options: -help|h --output STRING Output folder. --asGroup STRING Output of program ASRecovist, i.e. "AS_event_group.xls" --asEvent STRING Output of program ASRecovist or ASAffectORF, i.e. "AS_event.xls" or ASAffectORF_event.xls --trExpFile STRING A file with expression levels of transcripts in different samples. --qvalue FLOAT q-vlaue cutoff [default: 0.05] --expCutoff FLOAT Expression level cutoff. A transcript will be considered to be not expressed if its expression level less than this cutoff.
Note: "--trExpFile" input file format (column separated by Tab): Gene Transcript Sample1 Sample2 ... g1 tr1 0.5 20 ... g1 tr2 53 19 ... |
The output file of ASRecovist will be as the input of ASQuantityDiff.
The expression information of each transcript in a gene is the input of ASQuantityDiff as well (--trExpFile).
The alternative splicing events significantly regulated between samples will be counted in outputted summary file (--qvalue).
ASQuantityDiff outputs four files, i.e. ASExpDiff_event.xls, ASExpDiff_event.summary.xls, ASExpDiff_event_group.xls and ASExpDiff_event_group.summary.xls, which are corresponding the four files outputted by ASRecovist.
Compared to AS_event.xls and AS_event_group.xls, some more columns are in ASExpDiff_event.xls and ASExpDiff_event_group.xls. Added column:
Column |
Description |
Example |
Sample1 |
sample 1 name |
Sample2 |
Sample2 |
sample 2 name |
Sample3 |
Tr1_Sample1_Exp |
expression of transcript 1 in sample 1 |
30.4259 |
Tr2_Sample1_Exp |
expression of transcript 2 in sample 1 |
2 |
Tr1_Sample2_Exp |
expression of transcript 1 in sample 2 |
49.581 |
Tr2_Sample2_Exp |
expression of transcript 2 in sample 2 |
2 |
p-value |
statistic p-value |
1.00E+00 |
q-value |
statistic q-value |
1.00E+00 |
In an alternative splicing group, the expression of transcript 1 or 2 are the sum of transcripts in the group.
Compared with AS_event.summary.xls and AS_event_group.summary.xls, some more columns are in ASExpDiff_event.summary.xls and ASExpDiff_event_group.summary.xls. Added column in ASExpDiff_event.summary.xls:
Column |
Description |
Example |
Sample1 |
sample 1 |
Sample2 |
Sample2 |
sample 2 |
Sample3 |
AS Event QuantityDiff |
number of alternative splicing events significantly regulated |
1 |
Gene with AS Event QuantityDiff |
gene number … |
1 |
Transcript with AS Event QuantityDiff |
transcript number … |
2 |
Sample1 Specific AS Event |
alternative splicing event occurred in sample 1 only |
1 |
Sample2 Specific AS Event |
alternative splicing event occurred in sample 2 only |
0 |
Columns added in ASExpDiff_event_group.summary.xls are similar.
perl ASQuantityDiff.pl --asEvent ASAffectORF_event.xls --asGroup AS_event_group.xls --trExpFile isoform_exp.txt --output ASQuantityDiff_out
NAME Check AS event in CDS region.
SYNOPSIS Usage: perl ASAffectORF.pl --gtf <gtf file with CDS annotation> --asEvent <AS event file> --output <output folder> Options: -help|h --gtf STRING Input gtf format file with CDS annoation --output STRING Output folder. --asEvent STRING Output of program ASRecovist , i.e. "AS_event.xls" |
The input of ASAffectORF are the GTF file with CDS annotation, and AS_event.xls, which was outputted by ASRecovist.
Two file are outputted by ASAffectORF, i.e. ASAffectORF_event.xls and ASAffectORF_event.summary.xls.
Compared with AS_event.xls, columns added in ASAffectORF_event.xls are:
Column |
Description |
Example |
AS Event Location |
alternative splicing event occurred region |
G04034T0(CDS),G04034T1(CDS) |
AS Event Frame Change |
base number of frame change |
0 |
Tr2_vs_T1 ORF Diff Tag |
change tag of ORF |
frame_full_same,start_same,stop_same |
ASAffectORF_event.summary.xls: Summary of alternative splicing events in ASAffectORF_event.xls.
perl ASAffectORF.pl --gtf anno.gtf --asEvent output_svg/ASRecovist_out/AS_event.xls --output output_svg/ASAffectORF_out
NAME Run Alternative splicing Analysis Tool Package.
SYNOPSIS Usage: perl runASATP.pl --gtf <gtf file> --trExpFile <transcript_expression_file> --output <output_folder> [--graph no] [--graphFormat SVG] Options: -help|h --gtf STRING Input gtf format file. --output STRING Output folder. --trExpFile STRING A file with expression levels of transcripts in different samples. --graph no|yes Create graph or not. default [no] --graphFormat SVG|png Graph format. default [SVG]
Note: "--gtf" input file should contain CDS annotation. "--trExpFile" input file format (column separated by Tab): Gene Transcript Sample1 Sample2 ... g1 tr1 0.5 20 ... g1 tr2 53 19 ... |
runASATP is a pipeline to run ASRecovist, ASQuantityDiff and ASAffectORF. Therefore, the input and the output files were the same as ASRecovist, ASQuantityDiff and ASAffectORF.
NAME Transform AS pattern to bit matrix.
SYNOPSIS perl asp2bit.pl –asp aspCode --output <output_fold> [--graph no] [--graphFormat SVG]
Options: -help|h --asp Alternative splicing pattern code, e.g. 16 --graph no|yes Create graph or not. default [no] --graphFormat SVG|png Graph format. default [SVG] --output STRING Output folder.
|
The input is the alternative splicing pattern (ASP) code. The output is the bit matrix corresponding to ASP code. Moreover, the graphic structure of an alternative splicing event can be drawn as well.
NAME Transform bit to ASP code.
SYNOPSIS perl bit2asp.pl --bit bitCode --output <output_fold> [--graph no] [--graphFormat SVG]
Options: -help|h --bit Bit code, e.g. 10001,--101 --graph no|yes Create graph or not. default [no] --graphFormat SVG|png Graph format. default [SVG] --output STRING Output folder. |
The input of bit2asp is a bit matrix, and the output is ASP code. bit2asp can also draw graphic stricture of an alternative splicing event.
NAME Split a gtf file when it's too large to process.
SYNOPSIS perl splitGtf.pl <file.gtf> <output_prefix>
|
The input is a large GTF file. The output is a series of small GTF files.